Mixed DI Questions
In this article, we are going to have a look at the various kinds of mixed DI sets, i.e. where two or three DI graphs are given.
Type 1: Bar Graph and Line Chart
Q. Study the graph given below and answer the 4 (four) items that follow.
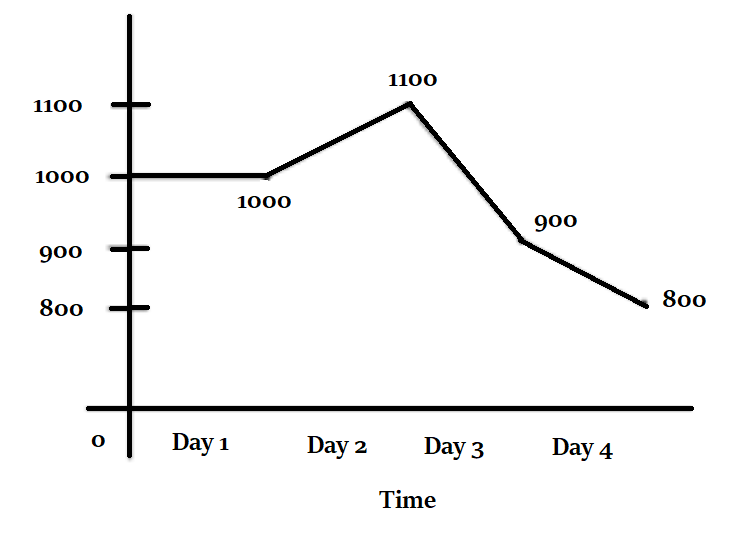
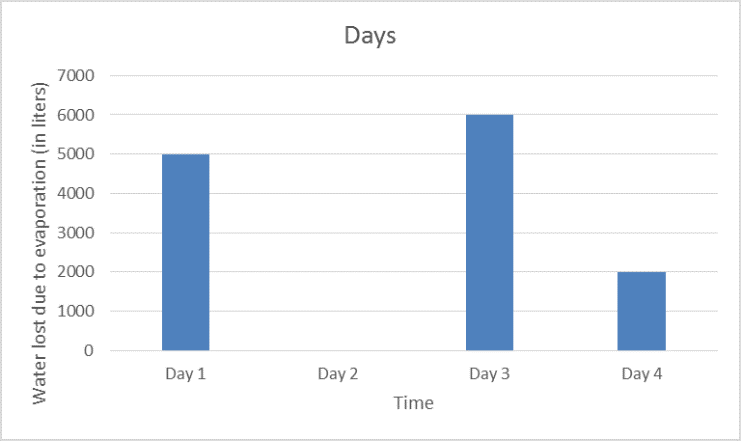 Rain is the only source of water into the pond. However, water from the pond is lost not only through evaporation, but also because of extraction of water from it for agricultural purposes.
Q1. What are number of days that it must definitely have had rained over the pond?
(a) 1 (b) 2 (c) 3 (d) Cannot be determined
Q2. For how many days was water extracted out of the pond for agricultural purposes?
(a) 0 (b) 1 (c) 2 (d) Cannot be determined
Q3. If it rained 100 kilo liters every day, then on which day was the maximum water extracted out for agricultural purposes?
(a) Day 1 (b) Day 2 (c) Day 3 (d) Day 4
Q4. What is the approximate average evaporation rate of the pond water (in liter/hour), over the given four days?
(a) 164 (b) 202 (c) 105 (d) 135
Explanation:
Answer 1: (b)
As the only source of water into the pond is rain, we can see that it must have rained on the first and the second day. The quantity of water in the pond remains constant throughout the day 1 irrespective of evaporation of 5000 liters of water. Hence, it must have rained on day 1.
Similarly, the volume of the water in the pond increase on day 2, which is a sure shot sign of rain.
We cannot say for certain whether it rained on day 3 and 4 or not.
Answer 2: (c)
The only inlet of water to the pond is rain, while there are two outlets, vis-à-vis evaporation and extraction of water for agricultural purposes. We know the quantity of water evaporated each day but have no idea of the quantity of water that came via rain or that was extracted for agricultural purposes. However, we can determine for sure the number of days that the water lost by the pond was more than the water lost due to evaporation. It will imply that some water must have had been extracted out for agricultural purposes.
On day 1, the quantity of the water in the pond remained constant at 1000 kilo liter and 5000 liter of water was lost through evaporation. It may mean that it rained 5000 liter if no water was taken out for agricultural purposes and even more if water was indeed taken out for agricultural purposes too. We cannot say for sure.
On day 2, the quantity of water has increased. Again we cannot say for sure whether water was extracted out.
However, on day 3 and 4 the quantity of water in the pond decreased much more than that lost due to evaporation. Hence, definitely some water was taken out for agricultural purposes too.
Answer 3: (c)
Water extracted out for agricultural purposes = Quantity of rain – Quantity of water evaporated – Increase in the quantity of water in the pond.
Let us apply this formula for the given four days:
Day 1: Water extracted out = 100000 – 5 – 0 = 99995 liter.
Day 2: Water extracted out = 100000 – 0 – 100000 = 0 liter.
Day 3: Water extracted out = 100000 – 6 – (-200000) = 299994 liter.
Day 4: Water extracted out = 100000 – 2 – (-100000) = 100008 liter.
Hence, on day 3 maximum quantity of water was extracted out.
Note that instead of going through the cumbersome calculation as shown above, we can arrive at the above conclusion by just glancing through the two graphs. We may ignore the quantity of water that evaporated as it’s negligible as compared to the amount of rain or the quantity of water in the pond. As the quantity of rain is constant throughout the four days, the maximum decrease in the quantity of water in the pond on day 3 can almost entirely be attributed to the quantity of water extracted out for agricultural purposes.
Answer 4: (d)
Average evaporation rate of the pond water = (5000 + 0 + 6000 + 2000)/4 = 13000/4 = 3250 liter/day = 3250/24 liter/hour = 135 liter/hour.
Type 2: Bar Graph and Pie Chart
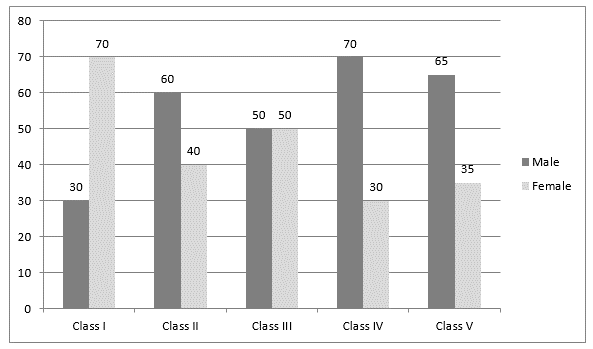
Q. Study the graph given below and answer the 2 (two) items that follow.
The bar graph represents the gender-wise percentage of the students of five classes from I to V.
The pie chart given below represents the percent-wise break up of students among the five classes of the school. Total Number of students = 3,500.
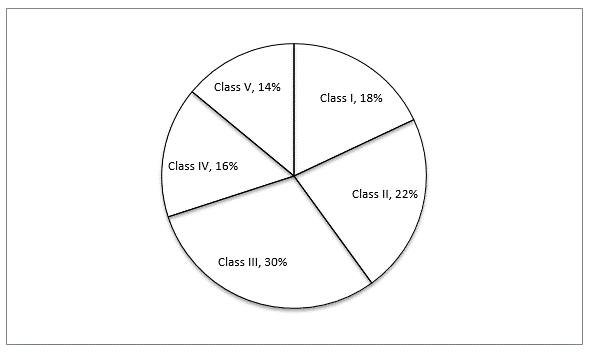
Q1. Total number of students of class III is approximately what percentage of the number of students of class IV?
(a) 279% (b) 147% (c) 185% (d) 312%
Q2. What is the difference between the number of females in Class I and the number of females in Class III?
(a) 90 (b) 83 (c) 72 (d) 84
Explanation:
Answer 1: (c)
After studying the pie chart we can see that Class III has 30% students whereas class IV has 16% students. Clearly, the percentage will be just less than 200%.
Required percentage = (30/16) × 100 = 187.5%
Answer 2: (d)
We will get total number of students in a class by analyzing pie chart and for getting number of female students we will refer the bar graph.
Number of females in Class I = 70% of 18% of 3500 = 0.7 × 0.18 × 3500 = 441
Number of females in Class III = 50% of 30% of 3500 = 0.50 × 0.30 × 3500 = 525
Hence, required difference = 525 – 441 = 84