Basic Approach to Bar Graph
What is bar graph?
Just like a Line chart, a Bar graph also represents the trend and correlation among the variables on the X and the Y axis. The bar graph may be vertical as shown below or horizontal. Moreover, there may be many other variations possible.
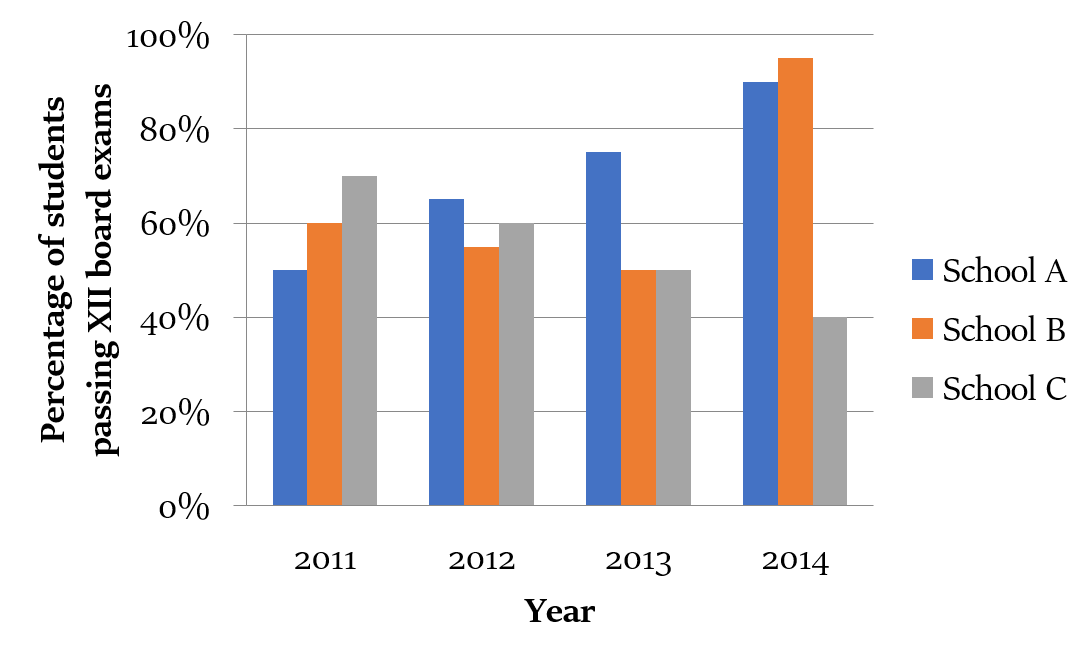
In a vertical bar graph, the X-axis generally represents a discrete variable, e.g. company name, year etc. The height of the bar may represent the value or frequency.
Bar graph also allows us to draw comparisons within the represented discreet variable, e.g. how has been the performance of school A in the years 2011, 2012, 2013 and 2014.
Q. Directions for the following 2 (two) items
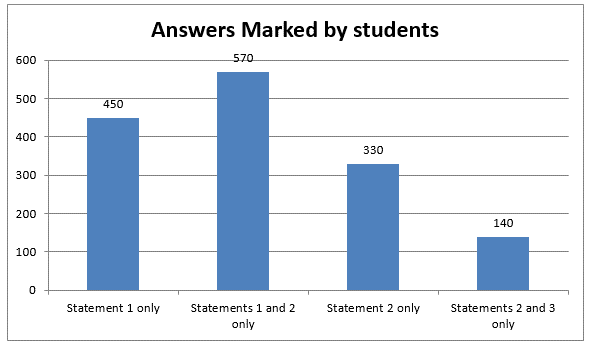
In a question in an examination, the students were asked to choose the correct statements from three given statements. The four options given to the students were - Statement 1 only, Statements 1 and 2 only, Statement 2 only and Statements 2 and 3 only.
The number of students who marked each of the options is given in the bar chart given below. Assume none of the students left this question blank.
 Q1. Which of the following statement was considered correct by maximum number of students?
(a) Statement 1
(b) Statement 2
(c) Statement 3
(d) Cannot be determined.
Q2. What percentage of students considered the statement 2 as correct?
(a) 69.8%
(b) 38.2%
(c) 22.2%
(d) None of the above.
Explanation:
Answer 1: (b)
Maximum number of students, i.e. 1040, consider statement 2 as correct.
Hence, option (b) is the correct answer.
Answer 2: (a)
Total number of students = 450 + 570 + 330 + 140 = 1,490
Percentage of students who consider statement 2 as correct = (1040/1490) × 100 = 69.8%
Hence, option (a) is the correct answer.
Q. Observe the two graphs given below and answer the 2 (two) items that follow.
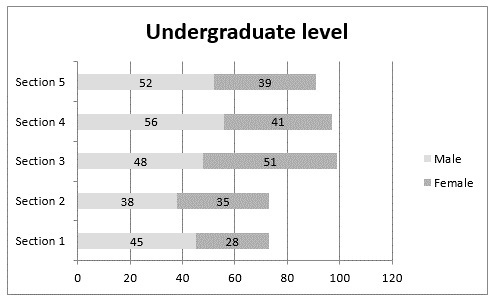
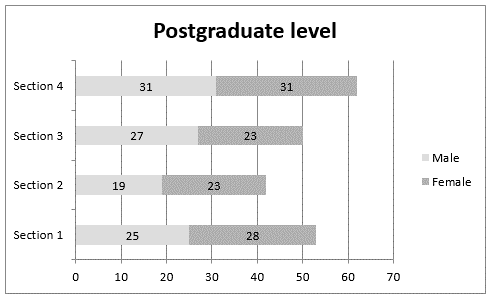 The graphs given above represent the number of male and female students in various sections of undergraduate and postgraduate level.
Q1. What is the approximate difference between the percentage of female students at undergraduate and post-graduate level?
(a) 5%
(b) 10%
(c) 9%
(d) 12%
Q2. Which undergraduate section has the least percentage of male students?
(a) Section 1
(b) Section 2
(c) Section 3
(d) Section 4
Explanation:
Answer 1: (a)
Number of female students at undergraduate level = 194
Total number of students at undergraduate level = 433
So, percentage of female students at undergraduate level = 194/433 = 44.8%
Number of female students at postgraduate level = 105
Total number of students at postgraduate level = 207
So, percentage of female students at postgraduate level = 105/207 = 50%
Required difference = 50 – 44.8 = 5.2%, i.e. option (a) approximately.
Answer 2: (c)
Percentage share of male students in Section 1 = (45/73) × 100 = 61.6%
Percentage share of male students in Section 2 = (38/73) × 100 = 52%
Percentage share of male students in Section 3 = (48/99) × 100 = 48.5%
Percentage share of male students in Section 4 = (56/97) × 100 = 57.7%
All the sections except section 3 have more than 50% male students. In fact it could be observed just by comparing the number of male and female students in various sections at undergraduate level. There is no need to calculate the above percentages.