Data Table based Data Interpretation sets
What is Data Table?
Data Table is a specific type of data representation wherein the data is represented in the form of a table.
Now, let us have a look at the various types of questions that you may enounter in Data Table based DI sets.
You will often encounter the following types of questions based on a Data Table:
- Simply find/locate the value of a variable from the table, e.g. what is the value of A in the year 2021 etc.
- Find the percentage, e.g. A is how much percent of B, or what is the percentage growth in A over the years etc.
- Find the ratio, e.g. what is the ratio of A to B, or how many times has the value of A grown over the years etc.
- Find the average, e.g. what is the average value of A over n years etc.
Types of Data Table based Questions
Type 1: Just Add or Subtract
Q. The table represented below shows the number of students of five schools A, B, C, D and E, who appeared in the examination of four subjects, Science, Maths, English and Hindi. Study it and answer the 2 item that follows.
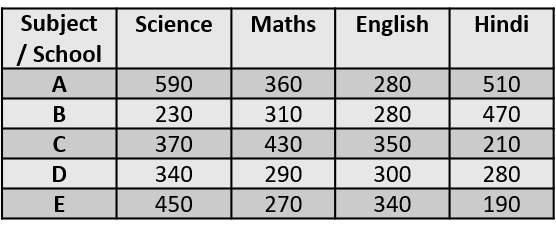 Equal number of students appeared in case of which of the following pair of subjects’ examination?
(a) Science and Maths
(b) English and Hindi
(c) Science and English
(d) Maths and Hindi
Explanation:
Total number of students that appeared for Science = 1,980
Total number of students that appeared for Maths = 1,660
Total number of students that appeared for English = 1,550
Total number of students that appeared for Hindi = 1,660
So, we can see that the same number of students appeared in the examination of Maths and Hindi.
Answer: (d)
Q. Directions for the following 2 (two) questions:
Observe the table given below, regarding the height of students in a school and answer the items that follow.
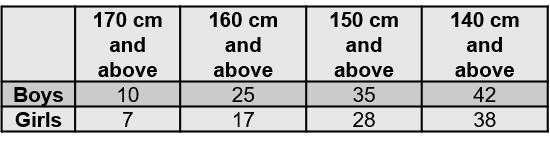
Q1. How many boys and girls have height greater than or equal to 150 cm but below 160 cm?
(a) 17 (b) 21 (c) 25 (d) Cannot be determined
Q2. If no one is below 140 cm of height, then how many boys and girls are there in the school?
(a) 192 (b) 156 (c) 80 (d) 63
Explanation:
Answer 1: (b)
We have to subtract number of boys and girls who are 160 cm and above from those having height 150 cm and above.
Thus, boys with height greater than or equal to 150 cm but below 160 cm = 35 – 25 = 10
Girls with height greater than or equal to 150 cm but below 160 cm = 28 – 17 = 11
Hence, the total number of such boys and girls = 10 + 11 = 21
Answer 2: (c)
As no one in the school is below 140 cm of height, it means that everyone must be either 140 cm long or more. The last column of the table represents boys and girls who are 140 cm and above.
Thus, total number of boys and girls in the school = 42 + 38 = 80
Type 2: Data Table DI Set
Q. Directions for the following 2 (two) questions:
Observe the table given below, regarding the salary and expenditure of Mr. X and answer the items that follow. The figures shown are in thousands.
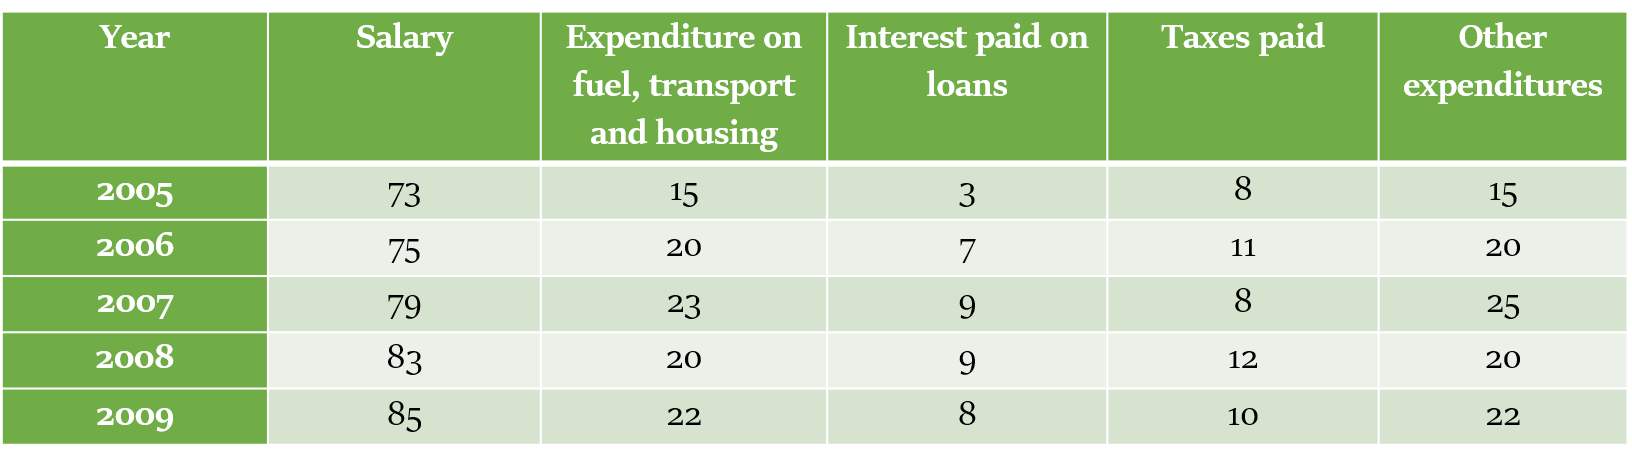
Q1. The amount paid by Mr. X as taxes is what percentage of the total expenditure on fuel, transport and housing done by Mr. X?
(a) 47% (b) 39% (c) 49% (d) 53%
Q2. What is the average amount of taxes that Mr. X had to pay over the period of given five years?
(a) Rs. 8,800 (b) Rs. 9,800 (c) Rs. 10,000 (d) Rs. 9,500
Explanation:
Answer 1: (c)
Total expenditure on fuel, transport and housing = 15 + 20 + 23 + 20 + 22 = 100 thousand
Total expenditure on taxes = 49 thousand
Thus, the required percentage = (49/100) × 100 = 49%.
Answer 2: (b)
As average is asked we have to add total taxes paid by Mr. X and divide it by the number of years.
Total taxes paid= 8 + 11 + 8 + 12 + 10 = Rs. 49 thousand
Number of years = 5
Average amount of taxes = 49/5 = Rs. 9.8 thousand = Rs. 9,800